

Introduction
The obvious place to start when considering how Net Zero impacts consumers is to ask, “how much does it raise our energy bills?”
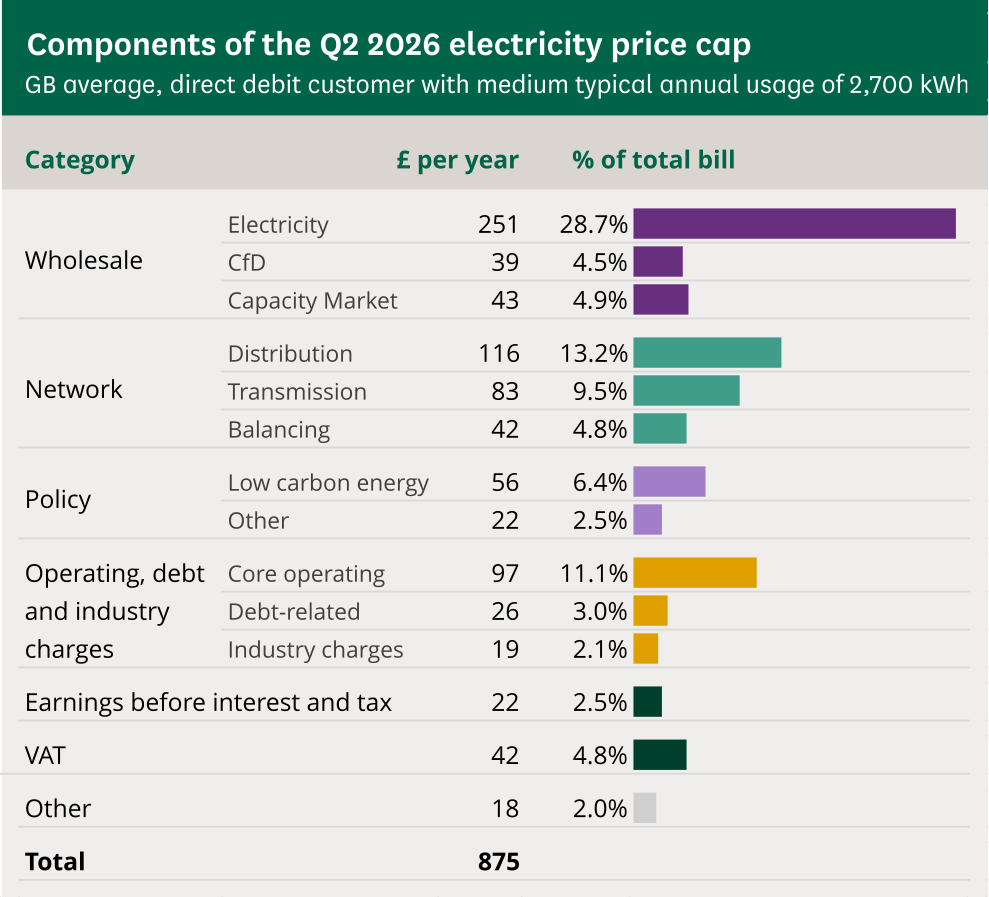
The UK Government helpfully explain how the energy price cap is made up in their 13th May 2026 report What costs make up an electricity bill? And summarised in the following diagram:
All the analysis that follows is based on this document unless otherwise stated.
The lower bound for policy costs is £78 / year. This combines explicit levies for Low Carbon Energy policies and other renewable policies (Feed-in Tariffs £21, Warm Home Discount £17, and remaining Renewables Obligation share after moving 75% from bills to general taxation).
However, we also need to add in the low-carbon and system support items that sit outside that Policy line in other parts of Ofgem’s cap, as follows:
Contracts for Difference (CfD): £39 / year (categorised by Ofgem under Wholesale costs).
Nuclear Regulated Asset Base Levy (nRAB): £13 / year (collected via unit rates for new nuclear construction).
Balancing & Constraint Costs: £42 / year (categorised by Ofgem under Network costs)
However, NESO state that thermal constraints are responsible for 60% of balancing and constraint costs, reducing £42 to £25.
Therefore, the broader total for electricity bills = £78 + £39 + £13 + £25 = £155.
This places the broader direct contribution at ~£155 / year, or ~19% of a typical net £833 annual electricity bill (i.e. excluding VAT).
There are three other areas where Net Zero policies impact consumers and will inevitably increase taxation and/or raise energy bills.
Network & Grid Infrastructure Expansion
Grid expansion is estimated at ~£70 billion in planned transmission grid investments between 2025–26 and 2030–31. I could not find an official estimate for how much of this total is associated with integrating renewable energy in order to avoid constraint costs. However, it is generally understood that renewable integration is the principal driver with smaller system costs for baseline asset replacement (e.g., replacing 50-year-old transformers and overhead lines) and general peak demand growth.
Overall, this is likely to add ~£60 / year to consumer network charges by 2030 but could be offset by ~£30 / year due to avoided constraint payments (which reached £1.9bn in 2025–26).
Taxpayer-Funded Expenditure
The 75% Renewables Obligation (RO) tax transfer from electricity bills will add ~£2.10bn – £2.58bn / year public spending. For 2026-2029 this will lead to a commitment of £6.875 billion. Add to this the £15 billion public investmentcommitment under the Warm Homes Plan. The Warm Homes Plan is intended to reduce energy bills by helping householders to install insulation and heat pumps. Whether this goal is achieved is open to speculation.
Therefore, we are looking at an average per-household tax share of ~£70–£90 / year in taxation for the RO transfer plus ~£500 total public investment per household over the lifetime of the Warm Homes Plan.
These values will vary according to each individual’s tax status, meaning that higher rate taxpayers will carry the greatest burden, in effect subsidising the energy costs of poorer households. It is not clear to me how many consumers appreciate the significance of this aspect of our taxation system, but I suspect very few.
Carbon Pricing & Wholesale Market Dynamics
According to the HMRC the Carbon Price Support rate is £18 per tonne. DESNZ gives a UK ETS reference price of £53 per tonne. Using the official DUKES baseline of 0.45 tonnes/MWh used by DESNZ for UK ETS/CPS calculations and the same carbon prices gives:
(£18+£53.19) x 0.45 x 2.7 = £86.50
where 2.7 is the average annual electricity used in MWh.
Therefore, the Gross Carbon Levy is ~£87 / year per household in carbon taxes and is embedded inside the £333 annual wholesale electricity cost line (see chart earlier).
However, the government argues that this tax on fossil fuel generation helps to offset the impact of more expensive fossil fuel generation as large-scale wind generation is expected to displace expensive gas plants in the merit order (see my previous post on marginal pricing). The forecast impact from an Energy and Climate Intelligence Unit (ECIU) study is a saving of ~£65–£70 / year per household cutting average wholesale electricity prices by ~25% (£24–£25/MWh).
Therefore, the overall net impact is forecast to be neutral. Whether this is achieved is clearly open to debate, but one thing is clear. As I discussed in my post Inertia and Reactive Power, increasing the proportion of low-inertia, intermittent energy is likely to make the grid less secure, whatever the impact on costs. Other commentators such as Kathryn Porter have written extensively on this topic, as I covered in my post Kathryn Porter warns of a looming energy crisis.
Summary
The headline cost of Net Zero policies in electricity bills is ~£155 / year, or ~19% of a typical net £833 annual electricity bill.
Upgrading the grid to better integrate renewable power will cost each household a net amount of ~£30 / year (consideringavoided constraint payments).
Changes to the Renewables Obligation will lead to a per-household tax share of ~£70–£90 / year in general taxation for the RO transfer plus ~£500 total public investment per household over the lifetime of the Warm Homes Plan.
Finally, carbon levies on fossil fuel generation are forecast to be cost neutral to consumers and taxpayers. Whether this is achieved will depend on the impact of an increasing proportion of low-inertia intermittent renewable energy.
Final thought
Kathryn Porter highlighted in her article Early winter ENM rings alarm bells, the fact that NESO have just raised another Electricity Margin Notice. This followed several this summer, something unheard of previously. I wonder how consumers will react if they realise the full extent of Net Zero costs and the increasing prospect of blackouts?